
Knowledge is power. Same is true in the stock investments scenario. A learned investor will keep away from making mistakes and will invest wisely. It is important to continue learning to invest better and this is most important in stock investments where things change everyday.
Our balance sheet series which you can find in Learn to Invest section gives some of the pointers on which companies can be compared. There are other parameters which can be helpful
in spotting a good company. In this post we will give an overview of some parameters which are repeatedly used while investing in stocks and can give much needed insights into the performance of the company. Investors routinely use such parameters to find good stocks to invest in. These parameters are collectively known as Performance Indicators.
Performance Indicators are used to gauge the company health and profitability year-on-year. We will cover some of the most basic of such parameters in this post. The data that is used to calculate these parameters can be found in the Balance Sheets of the companies and are generally publicly available.
Content Index
Return on Capital Employed (ROCE)
Return on Equity (ROE)
Return on Assets (ROA)
Operating Margin (OPM)
Debt
Debt Interest Coverage Ratio
CAGR
Price/Equity Ratio (PE)
Return on Capital Employed (ROCE):
This is used to indicate the management's efficiency to for generating revenue utilising the capital/assets (equity, retained earnings, long-term borrowings etc.). It is computed as :

or
or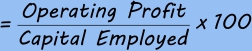
here EBIT stands for Earnings Before Interest & Tax
More EBIT for given capital or more profit for less capital will give higher ROCE% and indicates the capability of the company to service their debt. Any company will have a mixture of equity and debt as assets and the returns should be such that the company can justify the financial leverage(debt) and overcome the cost of borrowing.
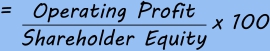
Return on Equity (ROE):

It gives the returns gained with respect to the shareholder equity and has a direct bearing on the market price of the company's stock. If the company is able to show a higher ROE then it means that it is using its funds judiciously and the trust of investors thus increases towards the company which in-turn reflects in increased share price.
Return on Assets (ROA):

It shows the returns gained by employing the company's assets year-on-year and shows the efficiency of the company in making profit. It is slightly different than ROCE in that ROCE is based on operating profit and ROA is based on Net profit.
Operating Margin (OPM):

It is computed as Operational Profit/Sales*100. It is the part that the company reserves for itself for each Rs100 sale of its product. It is expressed as percentage. An interesting conclusion can be derived by studying this parameter. Year-on-year, the cost involved in production (wages, raw material costs, running expenses) etc. keep increasing due to economic conditions. If the company is able to maintain its OPM at or nearly the same levels YOY then it reflects on the good brand recall of the product and hence we can conclude that the company is doing good business. Such a company is a good stock to invest in.
Debt:
Generally debt is considered in the negative sense by many. In reality a company's assets always consist of a mixture of debt and equity. Company's routinely take debt which they use to expand their businesses and scale operations. But for debt, the growth of the company would have slowed down considerably, if it had to base all future plans on its retained earnings and profit. It is not the debt that is bad but inability to service the debt with revenue/profit that spells doom for the company. The parameter of Debt/Equity ratio is also taken as Performance Indicator.
Debt Interest Coverage Ratio:
Computed as EBIT/Interest Expense, it gives the ability of the company to pay interest on its debt. Higher ratio means that the company can service its debt comfortably. An approximate ratio of 1.4 is taken as the borderline below which it is generally understood that the business is not generating sufficient revenue to service its debt for given period i.e YOY.
Compounded Annual Growth Rate (CAGR):
It gives the rate at which the given parameter has grown/ will grow for the period taken into consideration. It is a very important parameter which is used to average out small changes in the parameter over a period of time and give an accurate indication of growth and leads to predictability of future. Profit CAGR and sales CAGR are good indicators for inferring the growth of the company over a period of several years. Here is a nice calculator from Investopedia which you can use to find out the CAGR .
Price/Earning Ratio (P/E):
It is the ratio CMP/EPS. It gives the stock price as a multiple of its earning. It means that the market is paying a certain multiple of the company's EPS as its share price.
It directly reflects the trust/demand for the company and its share
A word of CAUTION here. A high P/E may mean an unjustified overvaluation which acts as a trap for innocent investor due to lack in company fundamentals
or
may reflect the trust the company has gained due to its past performance and expected future performance
or
reflects the company’s dominance in industry.
You must read this parameter in conjunction with other parameters above and the company history of performance to come to a correct conclusion. You can get more information on PE in our post on Buy Cheap or Buy Expensive.
We hope that this post will help our readers in learning to invest in stocks better. We have taken care to keep the explanation simple and MINUS any financial jargon. Keep following for further interesting posts.